Runtime vs planned time
See how downtime and planned production time affect the availability component.

OEE WITH OPERATIONAL CONTEXT
ClearRivet gives Australian manufacturing teams Overall Equipment Effectiveness alongside the running time, production rate, quality and downtime events driving the result—so OEE becomes an operational tool rather than just a report.
REAL CLEAR RIVET PRODUCT VIEW
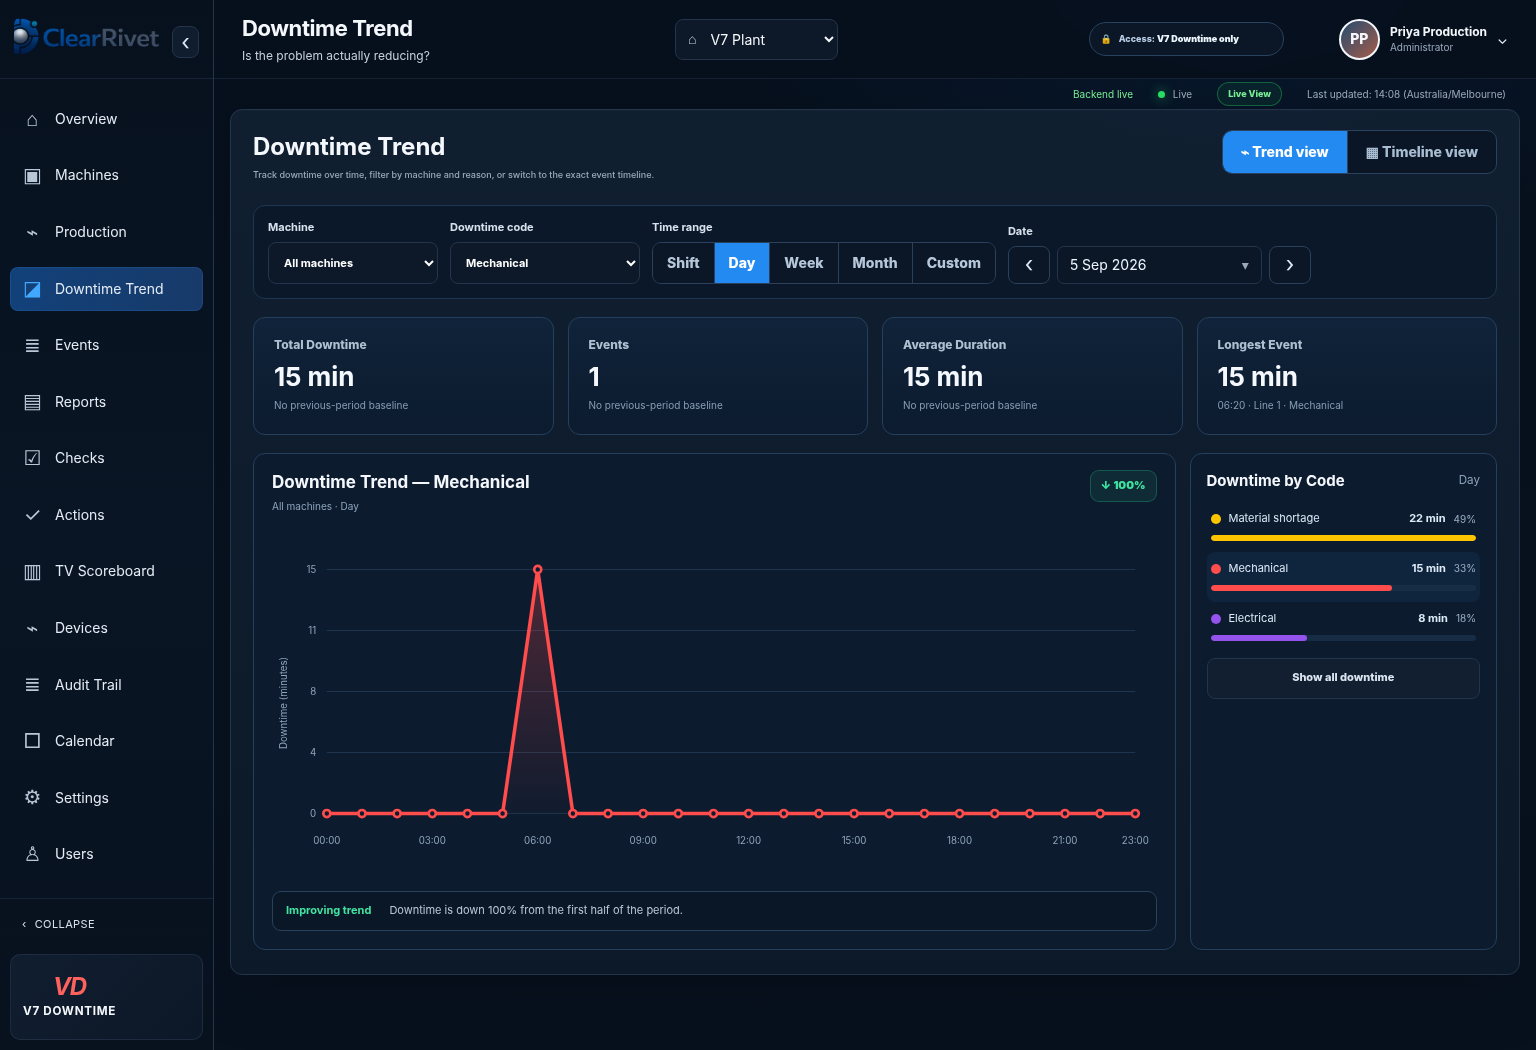
OEE is more useful when a team can move from an Availability loss into the actual events behind it. This ClearRivet screen is from a working test plant and shows the recorded downtime metrics, trend and reason breakdown that sit behind the KPI.
THE OPERATING PROBLEM
OEE combines Availability, Performance and Quality. The percentage is only the starting point. ClearRivet keeps the production events and operator context beside the KPI so teams can move from “OEE is down” to the specific downtime, speed or quality loss that needs attention.
See how downtime and planned production time affect the availability component.
Compare real production pace with the defined ideal or target rate.
Track quality losses so total production does not hide rejects or rework.
CLEARRIVET CAPABILITIES
ClearRivet is designed to keep the signal, production context and operational response in one record instead of scattering the information across paper logs, spreadsheets and disconnected dashboards.
OEE FOR DAILY OPERATIONS
Overall Equipment Effectiveness combines Availability, Performance and Quality. For day-to-day manufacturing decisions, the useful question is which component moved and what event caused it. ClearRivet keeps OEE beside the machine state, production rate, downtime reasons and quality result so teams can investigate the number instead of debating it.
Availability shows runtime compared with planned available time. Downtime events and their reasons provide the operating context behind the loss.
Performance compares actual output with the configured target or ideal rate, helping expose slow cycles and speed loss even when the machine never fully stops.
Quality shows the proportion of good production so rejects and rework do not disappear inside a healthy-looking total count.
FROM KPI TO IMPROVEMENT
A single OEE percentage can hide very different problems. Two machines can both show 70% OEE while one is losing time to breakdowns and the other is running slowly with almost no downtime. ClearRivet keeps the underlying event and rate history visible so improvement work can target the actual constraint.
That history also supports before-and-after comparison. If a team changes a setup method, repairs a recurring fault or reduces changeover time, the same machine and shift data can show whether the loss genuinely reduced.
COMMON QUESTIONS
OEE combines Availability, Performance and Quality to show how effectively planned production time is being converted into good output.
Yes. ClearRivet is designed to keep production and downtime events alongside the KPI so users can investigate the causes behind the result.
ClearRivet is designed for live operational monitoring so current production activity can be reflected during the shift rather than only after reporting closes.
RELATED SOLUTIONS
See it. Then prove it.