Live machine status
See which equipment is running or stopped without waiting for end-of-shift reporting.

MANUFACTURING DASHBOARDS
A dashboard is only as useful as the data behind it. The right approach depends on whether you need periodic reporting from existing data or live shop-floor visibility built directly from machine and operator events.
THE REAL QUESTION
Excel and Power BI can both produce attractive manufacturing dashboards. The important distinction is whether the plant already has accurate, timely data or whether the real problem is collecting that data from machines and operators in the first place.
If production counts, downtime, target rates and quality information are entered manually at the end of a shift, changing the visualisation tool does not automatically make the underlying data live or more reliable.
EXCEL
Excel is familiar, flexible and inexpensive. It can work well for small datasets, ad-hoc calculations, one-off improvement studies and operations where people are already recording reliable information in a structured way.
The limitation appears when teams want live visibility across multiple machines or shifts. Manual files can become dependent on individual users, vulnerable to version control problems, and difficult to keep current while production is running.
Excel also does not inherently know when a machine starts, stops, produces a part or falls behind target. That information still needs to come from somewhere.
POWER BI
Power BI is well suited to combining data sources, building management dashboards and analysing historical trends. For manufacturers with mature databases, historians, MES or ERP integrations, it can be an effective visualisation layer.
But Power BI is not a machine connectivity layer or operator downtime workflow by itself. A separate architecture is usually required to collect machine states, counts, reason codes and production context before the dashboard can display them.
For some plants that architecture is completely appropriate. For others, the engineering and maintenance burden can be larger than the original production-visibility problem.
DEDICATED SOFTWARE
A dedicated production monitoring platform combines the data collection and operational presentation layers. Instead of waiting for someone to assemble a report, the system can update machine status, output, downtime and OEE as the shift progresses.
This is most useful when supervisors need to know what is happening now, operators need a simple workflow for downtime context, and managers need consistent historical analysis without rebuilding spreadsheets every week.
See which equipment is running or stopped without waiting for end-of-shift reporting.
Show whether the machine or order is ahead or behind the expected output during the shift.
Add operator context to stops so losses can be grouped and prioritised.
Track Availability, Performance and Quality and drill into the events behind the KPI.
Surface production issues and calls for help to the people who need to respond.
Carry comments, checks and production context into the next shift rather than losing it in separate notes.
COMPARISON
| Need | Excel | Power BI | Live manufacturing software |
|---|---|---|---|
| Manual analysis | Strong | Strong | Available, but not the main reason to use it |
| Live machine-state collection | Requires external process | Requires external data source | Core capability when connected to the machine |
| Automatic production counts | Requires external process | Requires external data source | Core capability when connected to the machine |
| Operator downtime reasons | Usually manual | Requires separate input workflow | Can be built into the operator workflow |
| OEE calculation | Possible | Possible | Typically built in |
| Management visualisation | Good | Excellent | Focused on manufacturing operations |
| Rapid shop-floor deployment | Depends on manual process | Depends on integration architecture | Designed for this use case |
LIVE SOFTWARE EXAMPLE
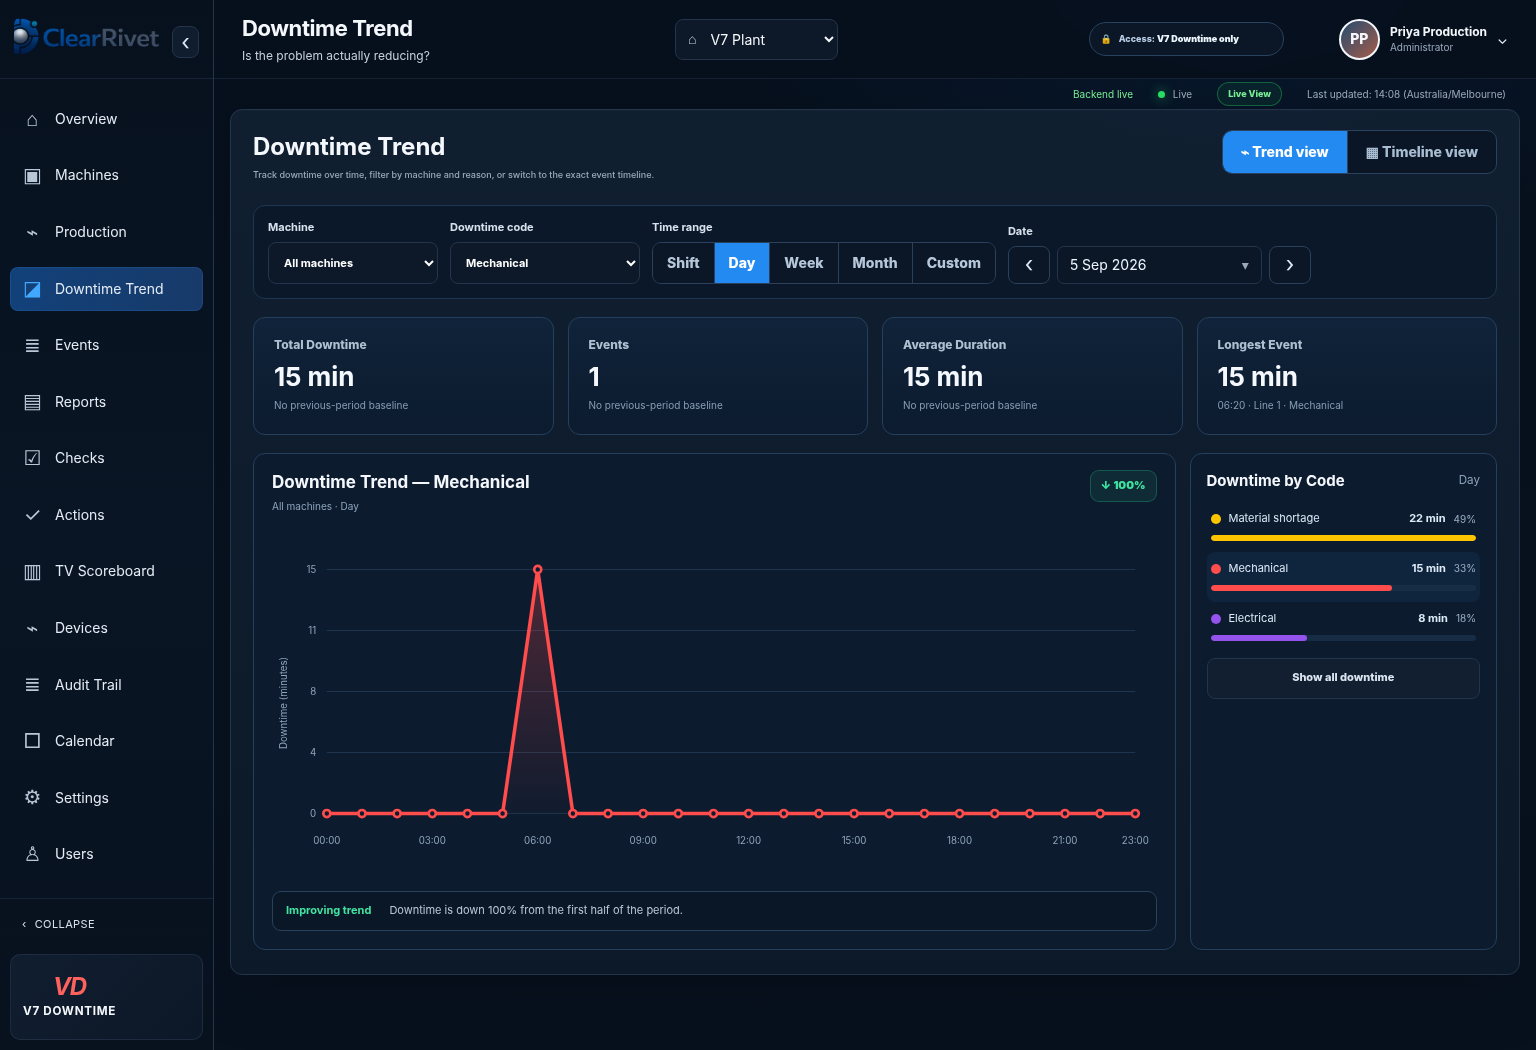
Excel and Power BI can be excellent reporting tools, but a manufacturing monitoring platform can also own the operational event itself. That means the dashboard can move directly from a recorded machine stop to its duration, reason, trend and follow-up context.
CLEARRIVET
ClearRivet is not intended to replace every spreadsheet or business intelligence tool in a manufacturer. It is designed to make live production activity easier to see and act on by combining machine data, operator context and production-management views.
It includes live machine status, production tracking, OEE, downtime Pareto, production orders, Andon visibility and shift handover. Data can then support broader analysis rather than forcing teams to reconstruct basic events after the shift.
COMMON QUESTIONS
Excel can work for manual or periodic reporting when the source data is reliable, but it does not by itself create live machine data or downtime context.
Power BI is a business intelligence and visualisation platform. It can display manufacturing data well, but separate systems or integrations are usually needed to collect live machine and operator data.
Dedicated software is useful when the plant needs live machine status, automatic production counts, downtime reasons, OEE, production targets and shop-floor workflows in one operational system.
EXPLORE MORE
See it. Then prove it.